


Három nem hagyományos recessziós mutató alkalmazhatósága a német gazdaságra
A stagnálással és recessziós hatásokkal kapcsolatos panaszok állandó velejárói a német gazdaságról folytatott közelmúltbéli vitáknak és diskurzusoknak, mind a gazdaság szegmenseiben, mind különböző iparágaiban. A hagyományos mutatók (amelyek egy nemrégi felülvizsgálat után az eddigieknél is borúsabbnak bizonyultak) rendszerint tükrözik ezeket az aggodalmakat. A német gazdaság állapota meghatározó jelentőségű az Európai Unió számos iparágának trendjei szempontjából, beleértve az autóipari és gyógyszeripari hálózatokat, amelyek gyakorta ezen gazdasági elemzések középpontjában állnak. A tágabb német gazdasági szférán belüli események és döntések – legyenek azok pozitívak vagy negatívak a viselendő következmények tekintetében – végiggyűrűznek az európai értékláncokon, valamint a pénzügyi hálózaton, amely hatások érintettjei alól Magyarország – kereskedelmi és ipari kapcsolatai révén – sem jelent kivételt.
Bár a tágabb geopolitikai és technológiai kontextus számos olyan tényezőt hordoz, amelyek egyértelműbbek az ilyen gazdasági trendek okaival kapcsolatban, érdemes lehet röviden megvizsgálni a kísérő jelenségeket mikroszinten is. A hagyományos mutatók elsődleges szempontok maradnak az értékelés és prognózis tekintetében, azonban néhány nem konvencionális mutató a fogyasztási szokások területén szintén előrejelezhet, vagy megerősíthet gazdasági állapotokat és azok változásait.
Nem hagyományos recessziós indikátorok
Az elmúlt néhány évtized egyre intenzívebb fogyasztási trendjei kapcsán, különösen a Globális Északon, mind termékek, mind szolgáltatások tekintetében, mintegy egy tucatnyi sajátos mutatót azonosítottak be recessziós előrejelzésként. Ezek különböző közvetlen és közvetett ok-okozati összefüggéseken keresztül fejtik ki hatásukat – az értékesítés volumene többé-kevésbé erősen pozitív, vagy egyes esetekben negatív korrelációban áll a gazdasági növekedés általános mozgásaival, beleértve a gazdasági visszaeséseket is.
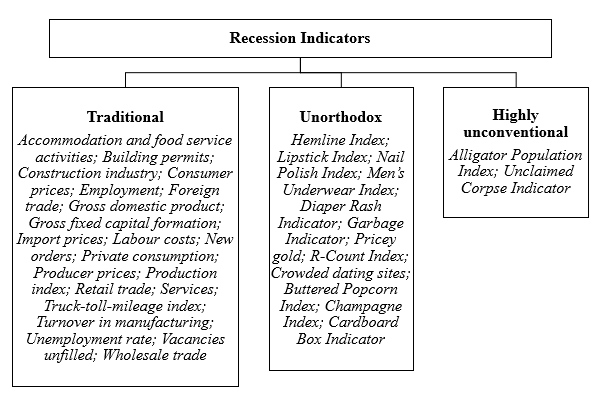
Anélkül, hogy minden egyes mutató részleteibe bocsátkoznék, az alábbi ábrában (1. ábra) csoportosítottam a Német Szövetségi Statisztikai Hivataltól, a Money As If hírlévélből és oldalról, valamint számos Google-keresésből és kevésbé formális online forrásból gyűjtött indikátor példákat. Az indexek osztályozása a hagyományostól a nem hagyományoson át a rendkívül szokatlanig terjed. Az utóbbi kategória a leginkább spekulatív.
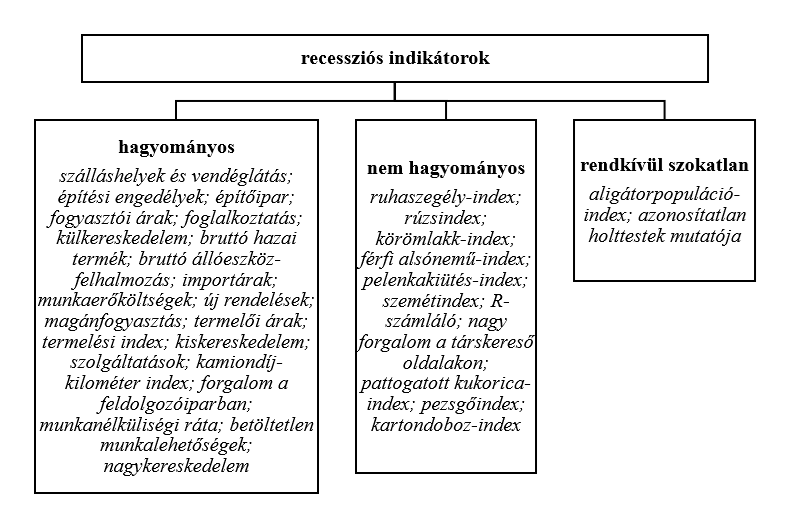
1. ábra: Recessziós indikátorok – saját osztályozás.
Empirikus alátámasztások, logikus magyarázatok, és hihető mechanizmusok ellenére a nem hagyományos indikátorok trendjeiről megbízható adatokat legjobb esetben is nehéz összegyűjteni, azonosítani és/vagy összeállítani, rosszabb esetekben pedig rendkívül szűkösek a rendelkezésre álló, elérhető adatok. Ebben a blogbejegyzésben három gyakoribb és alkalmasabb nem konvencionális recessziós indikátort elemzek a több szempontból még mindig gyengélkedő német gazdaságra vonatkozóan.
Rövid összehasonlítások
A rúzsindex a szépségipar-specifikus kifejezése annak a megfigyelésnek, hogy a megfizethető luxuscikkek értékesítése gazdasági visszaesések idején növekszik. A konkrét rúzseladások (amely értékek nem voltak közvetlenül elérhetőek) helyettesítőjeként a szélesebb “szépség- és személyes ápolási piac értéke” adatokat használtam, várva annak negatív kapcsolatát a GDP-növekedési adatokkal.
A pezsgőindex ezzel ellentétben a gazdasági optimizmus mutatójának tekintendő: a pezsgőfogyasztás magasabb szintje bőséget jelez, illetve okokat ünneplésre. A kihívás itt a német háztartási fogyasztói kiadások pezsgőre vonatkozó adatainak kinyerésében rejlik az általános alkoholos italokra vonatkozó adatokból. Az elérhető adathalmazok nem tették lehetővé ezt az opciót. Az általános alkoholos italokra vonatkozó fogyasztói kiadások magukban foglalják az alkoholizmus hatásait is, főleg nehéz időkben, például a munkanélküliség növekedése során. A túlzott alkoholfogyasztás problémája tekintetében Németország kiemelkedik az EU népesebb országai közül, a legmagasabb egy főre jutó átlagos éves mennyiséggel, 10,6 literrel. Ezért a GDP-növekedési számokkal való kapcsolat előjelét és erősségét csak előzetes információként szabad elfogadni, és óvatossággal érdemes kezelni.
A kartondoboz-indikátor feltételezetten pozitívan jelzi a gazdasági teljesítményt, erősen reprezentálva a kartondobozokban vásárolt és szállított tételek számát. Nem találtam közvetlenül németországi kartondoboz-gyártásra vonatkozó adatokat, azonban a kapcsolódó anyagok (például karton) Németországba való importja hasonló szerepet tölthet be a folyamatokban.
Az alábbi 1. táblázat 10 közelmúltbeli évet ölel fel, 2014-től 2023-ig, egy kerek számtartományt, amelyet a három kiválasztott indikátor (illetve helyettesítőik) adatainak rendelkezésre állása alapján választottam. Az adathalmaz kis mérete ellenére is megfigyelhetjük, hogy a kartondoboz-indikátor helyettesítőjének legalacsonyabb pontjai hogyan esnek egybe a német GDP-növekedés legnagyobb közelmúltbeli visszaeséseivel, 2020-ban és 2023-ban. A rúzsindex helyettesítőjének mozgásai kevésbé intuitívak, a mechanizmus hipotézise főleg az utolsó évben, 2023-ban bizonyul erősebben alátámasztottnak. Ami a pezsgőindex helyettesítőjét illeti, a folyamatos emelkedés kétszer szakad meg, minimálisan, közvetlenül a két negatív GDP-növekedésű év előtt.
|
év |
a szépségápolási piac értéke Németországban (millió euró) |
háztartások fogyasztói kiadásai alkoholos italokra Németországban (millió euró) |
cellulóz, papír és karton import Németországba (millió euró) |
német GDP-növekedés (%) |
|
2014 |
15,697 |
20,570.00 |
2,661 |
2,2 |
|
2015 |
15,996 |
24,230.00 |
2,933 |
1,7 |
|
2016 |
16,302 |
24,920.00 |
2,710 |
2,2 |
|
2017 |
16,540 |
25,440.00 |
2,824 |
2,8 |
|
2018 |
16,977 |
26,010.00 |
3,136 |
1,1 |
|
2019 |
14,046 |
26,690.00 |
2,759 |
1,0 |
|
2020 |
14,036 |
28,600.00 |
2,103 |
-4,1 |
|
2021 |
13,604 |
29,880.00 |
2,690 |
3,9 |
|
2022 |
14,333 |
30,520.00 |
3,378 |
1,8 |
|
2023 |
15,853 |
31,960.00 |
2,774 |
-0,9 |
1. táblázat: Három nem hagyományos recessziós indikátor és alkalmazhatóságuk
a német gazdaságra 2014-2023;
adatforrások (2-5. oszlopok, ebben a sorrendben): Statista, Statista, Eurostat, és Eurostat.
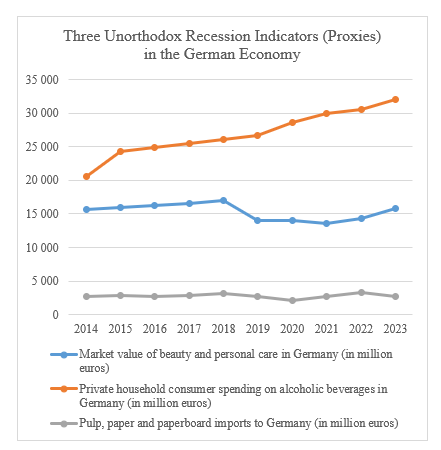
E három indikátor (jelen esetben szélesebb körű helyettesítőik) éves mozgásait az alábbi 2. ábrában is illusztráltam a német gazdaságra vonatkozóan. Bár a nem konvencionális mutatókkal kapcsolatos mechanizmusok nem erősíthetők meg kizárólag ezen kis adathalmaz alapján, egyes pontok alátámasztják kiegészítő, vagy részleges előrejelzési potenciáljukat.
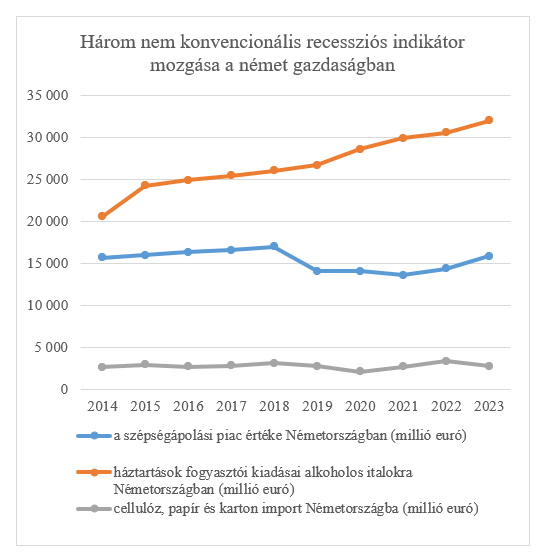
2. ábra: A három nem hagyományos recessziós indikátor (helyettesítőinek) mozgásai, 2014-2023;
adatforrások: lásd 1. táblázat.
A fluktuációk pontosabb vizsgálatához a 2. táblázat kizárólag a változásokhoz tartozó értékeket szemlélteti százalékokban, a 2015-től 2023-ig terjedő évekre vonatkozóan.
|
év |
változások a szépségápolási piac értékében Németországban (%) |
változások a háztartások alkoholos italokra való kiadásaiban Németországban (%) |
változások a cellulóz, papír és karton import értékében Németországba (%) |
német GDP-növekedés (%) |
|
2015 |
1.90 |
17.79 |
10.22 |
1.7 |
|
2016 |
1.91 |
2.85 |
-7.60 |
2.2 |
|
2017 |
1.46 |
2.09 |
4.20 |
2.8 |
|
2018 |
2.64 |
2.24 |
11.04 |
1.1 |
|
2019 |
-17.26 |
2.61 |
-12.02 |
1.0 |
|
2020 |
-0.07 |
7.16 |
-23.79 |
-4.1 |
|
2021 |
-3.08 |
4.48 |
27.95 |
3.9 |
|
2022 |
5.36 |
2.14 |
25.56 |
1.8 |
|
2023 |
10.60 |
4.72 |
-17.86 |
-0.9 |
2. táblázat: A három nem hagyományos recessziós indikátor értékeinek változásai (2015-2023);
adatforrások: lásd 1. táblázat; saját számítás.
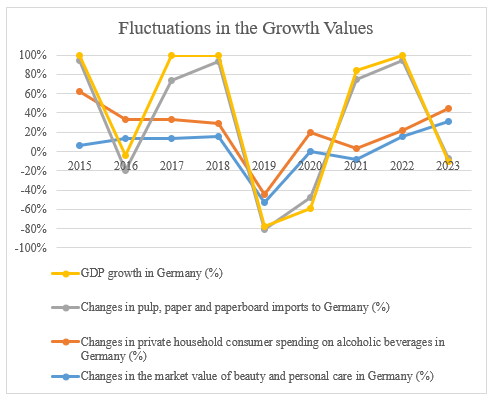
Ezeket a számokat – a gyors áttekintés érdekében – az alábbi, 3. ábra szemlélteti.
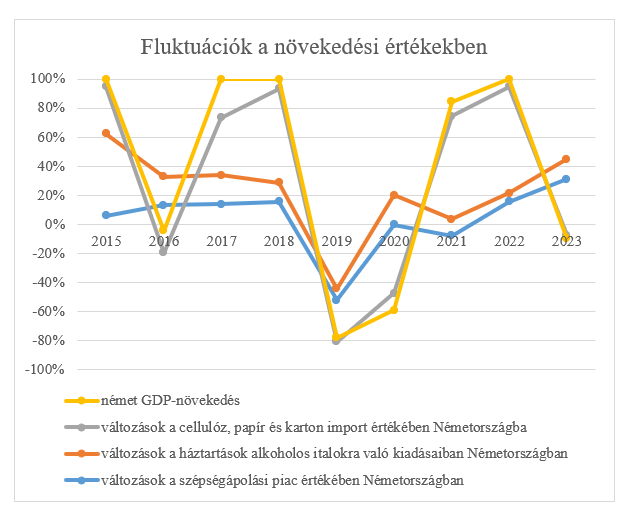
3. ábra: A három nem hagyományos recessziós indikátor értékeinek fluktuációi, 2015-2023;
adatforrások: lásd 1. táblázat.
Bár a szépségipar értékeinek együttmozgása a GDP-növekedéssel (a rúzsindikátor logikája alapján) indokolatlan lehet, és az alkoholos italok kisebb mértékben követik az általános gazdasági folyamatot, mint ahogy várható lett volna, de ahogyan ezek a trendek követik egymást, figyelemre méltóan hasonló. Ez – egy spekulatív megközelítésben – egyéb hatásoknak is köszönhető lehet, amelyek összességében semlegesítik egymást.
Összefoglalás
Bár viszonylag nehéz hozzáférni az ország- és termékspecifikus adatokhoz a nem konvencionális recessziós indikátorok esetén (kivéve, ha ezek iparág- vagy akár vállalat-specifikusan rendelkezésre állnak), azok tágabb indexekkel való közelítése kivitelezhető. A szélesebb helyettesítők nem bizonyultak teljes mértékben megbízhatónak a német gazdaságra nézve, de elemzésük lehetőséget ad a hagyományos recessziós indikátorok kiegészítésére.
Ez a blogbejegyzés csak egy bepillantást nyújtott a vonatkozó számok mozgásaiba, de a kiemelt egybeesések arra ösztönözhetik a közgazdászokat, hogy további mechanizmusokat és jeleket keressenek a makrogazdasági elemzés perifériáján, mivel ezek mélyíthetik és gazdagíthatják elemzéseinket és beszélgetéseinket.
Hajnal Zsófia